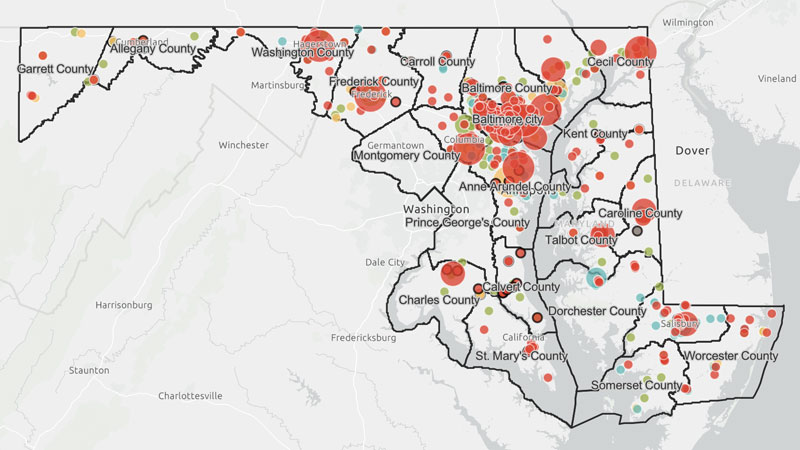
Marylanders from all walks of life and every community are affected by hunger in some way, and with the help of our all-new Maryland Hunger Map, we’re able to get a more accurate picture of what hunger really looks like in this state.
We’re Redefining Hunger and Using Data to Fight It
At the Maryland Food Bank, we use the Maryland Hunger Map to compare our existing presence and impact with places where there are “hunger hotspots” (unmet need) by:
- Assessing the existing need for food assistance services
- Quantifying current food distribution impact, and
- Identifying underserved communities
Then, we use the data to identify which tactics and resources are best suited for different parts of the state and will improve the lives of more Marylanders by helping them break free from the stubborn grip of hunger.
The Maryland Hunger Map
This resource is helping us do more for our neighbors, and we’re excited to have you explore the map to learn more about hunger.
Make sure you're up to date on the Maryland Hunger Map and other reports
Whether you're an academic looking for reliable data on food insecurity or just want to know what hunger looks like in your community, the Maryland Hunger Map is your best source for accurate information.
Exploring Hunger
This resource is helping us do more for our neighbors, and we’re excited to have you explore the map to learn more about hunger. Start in your own neighborhood, and experiment by clicking the different layers to see what hunger really looks like in your community. You can spend a few seconds to look up specific info or weeks to research trends.
Take a Deeper Dive into Hunger Statistics
See what the need looks like in your neighborhood.
Take a Deeper Dive into Hunger Statistics
See what the need looks like in your neighborhood.
Frequently Asked Questions
How do I use the Maryland Hunger Map?
Please see our How to Use the Maryland Hunger Map PDF to learn more.
What data is on the Maryland Hunger Map?
Toggling between the different data layers, you can use the map to learn about the Maryland Food Bank’s food distribution in your neighborhood and get informed about the specific needs and impacts. For example, you can toggle to a zip code, census tract, census place, or county to investigate child food insecurity, senior hunger, unemployment, or child and adult poverty levels. The Maryland Hunger Map is a heat map. Hence, fuller color tones indicate greater need (and inversely, impact). Research shows that Marylanders experiencing higher levels of poverty are more likely to be food insecure.
How does the Maryland Hunger Map provide a realistic view of hunger?
The United for ALICE (Asset Limited, Income Constrained, Employed) data has become a cornerstone of the Maryland Hunger Map because it reflects a more realistic measure of financial hardship. Unlike the Federal Poverty Level, the ALICE Household Survival Budget accounts for the actual costs of basic household necessities in Maryland, including the cost of housing, childcare, food, transportation, and health care, at a bare minimum “survival” level. To put it simply, traditional economic measures do not capture what ALICE workers and their families are experiencing in this unprecedented moment. Based on the latest data available, MFB estimates that 1 in 3 Marylanders (2 million neighbors) are at risk of becoming food insecure.
Does the map share information about the Maryland Food Bank’s impact?
The Maryland Hunger Map analyses the Maryland Food Bank’s food distribution over 12 months. The map generates detailed information about the distribution of food through our network of 1,200 distribution partners—faith-based organizations, schools, community groups, Pantry on the Go partners, and MFB Kids sites.
You can also learn about MFB’s grantmaking impact by clicking on the Capacity Grant data layer where you can locate some 90 nonprofits that were awarded capacity grants to increase food distribution impact, reach more neighbors in need, or increase the nutritional quality of food. To obtain updated information on the number of meals/pounds distributed to MFB’s network of community partners, visit mdfoodbank.org/response.
What other useful information does the map provide?
In addition to the information noted above, the Maryland Hunger Map can locate nearby MFB services and partners, using specific addresses to find nearby schools, community health centers, or SNAP retailers—and measure the distance to your home, your work site, or the nearest MFB partner agency.
Our map also visualizes demographics by ethnicity, age groups, poverty level, unemployment, and much more. It even includes major indicators of needs data from the American Community Survey, Census 2020, Feeding America, the Johns Hopkins Center for a Livable Future (Maryland Food Systems Map), and United Way’s ALICE Study.
For more information about the Maryland Hunger Map, please contact Daniel Sturm our VP of Learning, Measurement, and Evaluation.
Research and Reports
Find our latest original reporting and data-driven tools aimed at helping stakeholders and the public better understand and address the complexity of food insecurity in Maryland.


