Our Maryland Hunger Map in Action

When trying to address a societal issue as large as hunger, it takes a variety of tools to bring about demonstrable change. Since our founding in 1979, our mission has stayed the same, but the tools we have employed have changed continuously–reflecting current landscapes and best practices.
It’s now 2023, and our tools are evolving yet again.
Guided by MFB 3.0, our long-term strategic plan, we’re using more data than ever to increase access to nutritious food while opening pathways out of hunger for more Marylanders.
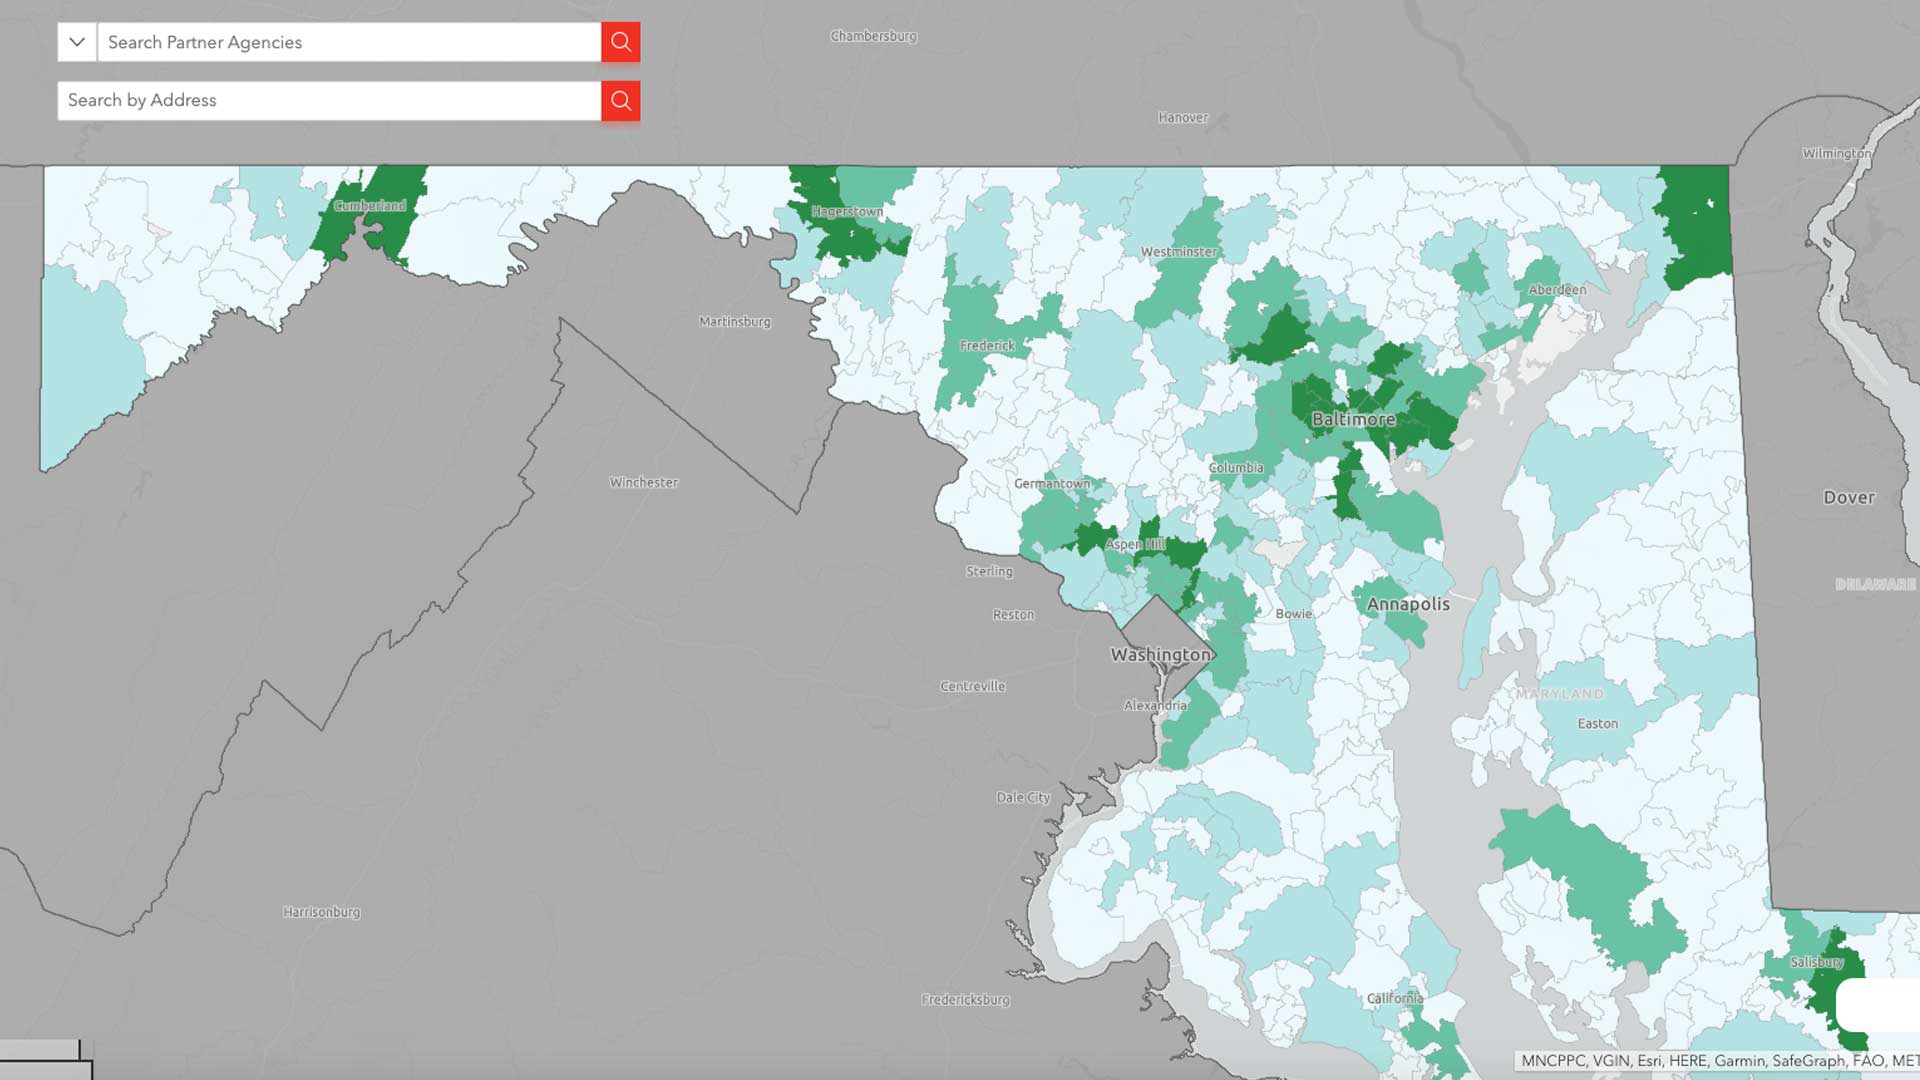
And our all-new Maryland Hunger Map is like a strategic GPS, helping us get to our end goal as quickly as possible, and with the least amount of roadblocks
Featuring more than a dozen data-rich layers, the Maryland Hunger Map (MHM) is a great resource for all kinds of research. From a reasonably simple educational query “What does hunger look like in my neighborhood?” to a complex, academic review of how various socio-economic factors combine to create barriers for Marylanders, the MHM is ready to provide accurate results.
Take a Deeper Dive into Hunger Statistics
See what the need looks like in your neighborhood.
Take a Deeper Dive into Hunger Statistics
See what the need looks like in your neighborhood.
Eliminating Hunger Hotspots
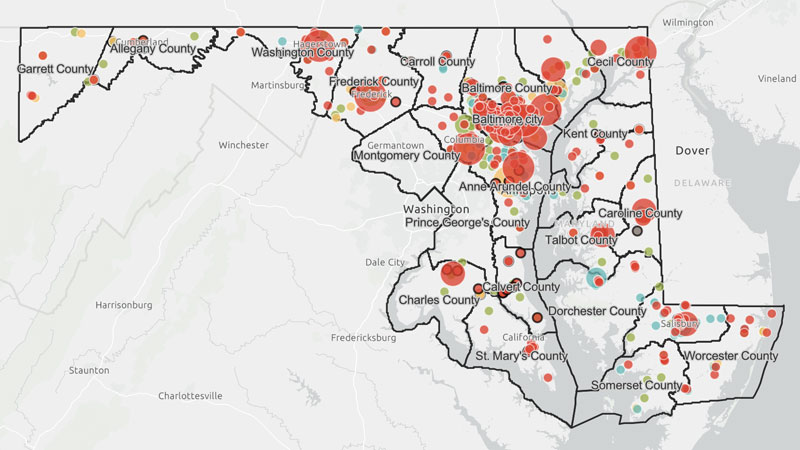
At the Maryland Food Bank, our Regional Program Directors use this map daily with a combination of other tools to visualize need, distribution sites, and demographic information before making programmatic recommendations that will have the maximum impact on our neighbors in need.
According to MFB’s Senior Regional Program Director, Rebecca Mann, she and her colleagues use the MHM to determine if there is a need for a new partner in an area, which would help eliminate the underserved or unreached areas we call hunger hotspots.
“With this tool, we can look at specific data points in a particular geographic area—the amount of food already being distributed, the number of partners in the community and the types of programs they are already running—and devise an action plan,” Mann said.
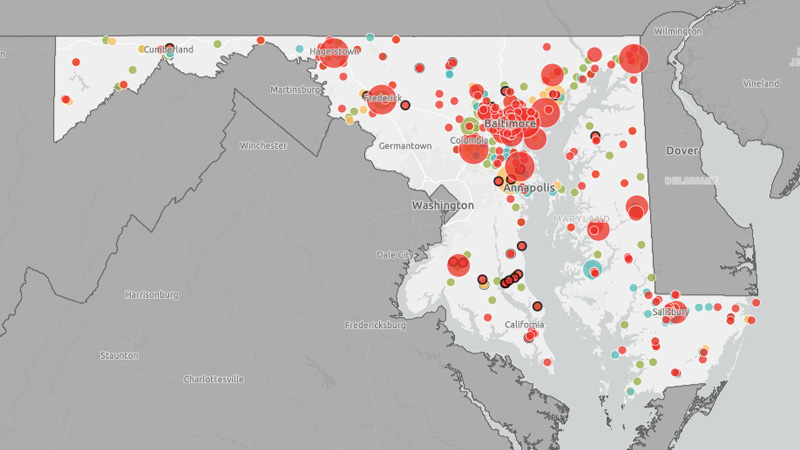
In Cecil County, for instance, the Hunger Map helped Mann recognize less populous areas that were in need of additional resources, leading to the deployment of MFB’s Mobile Market in the communities of Rising Sun and Conowingo.
“Not only do our Cecil County neighbors now have more access to food, but our partners there are better able to see what is already happening in their communities and can address unmet needs rather than perceived needs as a collective group,” Mann continued.
RPDs also take into account the additional resources that are available to Network Partners, such as Capacity Grants, to help determine the best solution. Now that the MHM includes a layer that identifies MFB partners that have been awarded Capacity Grants, RPDs can more actively encourage organizations to pursue capacity funding for projects in local hunger hotspots.
“The Maryland Hunger Map helps us ensure the equitable distribution of grant funds across the network. These funds help our partners offer more nutritious food and other services to their neighbors, so having current and accurate data is crucial to our ability to maximize their impact in local communities,” Mann continued.
Increasing Collaboration at the Local Level
The map is also a valuable tool that allows our partners and other community-based organizations to collaborate and problem-solve at the local level.
Following three years of virtual meetings and long-distance relationship building, our Programs team is bringing back in-person events (Partner Gatherings) that have historically made our partner network so strong.
Using the MHM, partners will be able to visualize where they are in relation to one another and intuitively perform asset mapping in real time, identifying where assets are present for ending hunger and where gaps persist.
With the new data available via the Hunger Map, partners now have the ability to hold deeper discussions on the issues that are meaningful to their neighbors, and craft solutions relevant to their community’s needs.
“The strength and resiliency that our partners demonstrated during the pandemic was humbling,” said Mann. “As we continue to navigate this new world together, this updated tool will help further strengthen the knots that tie the food assistance safety net together.”
“For researchers, locating information scattered across the internet can be daunting. With its Maryland Hunger Map, the Maryland Food Bank has created a very robust research tool – a centralized repository of statewide food insecurity related data, making it easy for anyone interested in learning more about hunger or devising solutions to alleviate it to find timely accurate information, all in one place.”
Mapping Out Advocacy
With up to 2 million of our neighbors potentially facing food insecurity, ending hunger can seem like an insurmountable task. Yet the Maryland Hunger Map allows us to parse hunger-related data into smaller points that help illuminate issues in a particular area.
So when we meet with the very people who have the power to affect change in Maryland — lawmakers at the local, county, and state levels — being able to show them just how much hunger is hindering their constituents’ ability to thrive can be eye-opening.
“The Maryland General Assembly is full of caring, passionate people who truly want to help their constituents thrive. Being able to share with them specific data on food insecurity in the districts they represent, and how the Maryland Food Bank is trying to provide food assistance and relief, is really, really compelling,” said Anne Wallerstedt, MFB’s Senior Director of Government Relations
Plotting a Course to End Hunger
As we continue our evolution into the food bank that our food-insecure neighbors need us to be, we will continue to be a data-informed organization, one that always looks for ways to do more, to say “Yes, we will be here for you with nutritious food, and also these other programs and services that can help eliminate the root causes of hunger
We see great potential in the Maryland Hunger Map’s ability to continue to help make MFB 3.0 a reality, bring our partners even closer together, help drive advocacy, and serve as a reliable source of information for academics, researchers, and policymakers.
Take a Deeper Dive into Hunger Statistics
See what the need looks like in your neighborhood.
Take a Deeper Dive into Hunger Statistics
See what the need looks like in your neighborhood.
